Honeybee colony losses continue to be unacceptably high. In the US this spring, colonies brought in to California to pollinate almonds from throughout the country, about half of the colonies were lost (New York Times, March 29, 2013). It is generally accepted that multiple pathogens ultimately bring down stressed colonies (Cornman 2012). However the role of pesticide stress on colonies remains controversial. Chronic exposure studies are often poorly constructed and frequently do not follow the exposed insects long enough for effects of the toxin to become evident. The best studies look at mortality, or behavioral effects, over a substantial fraction of the insect’s lifespan while varying the toxin concentration or dose. Time-to-effect studies lend themselves to a simple time dependent “power law” empirical model which can guide expectations for field toxicity effects (Tennekes 2011, Sánchez-Bayo 2009). Other reviews of the toxicity of imidacloprid (Cresswell 2011) attempt to establish specific “acute” or “chronic” levels, but this seems useless if the time of exposure is not explicitly included. Hence, I’ve made an effort to identify relevant time-to-effect studies in the literature most specifically for imidacloprid with insects of order hymenoptera, which includes bees and ants.
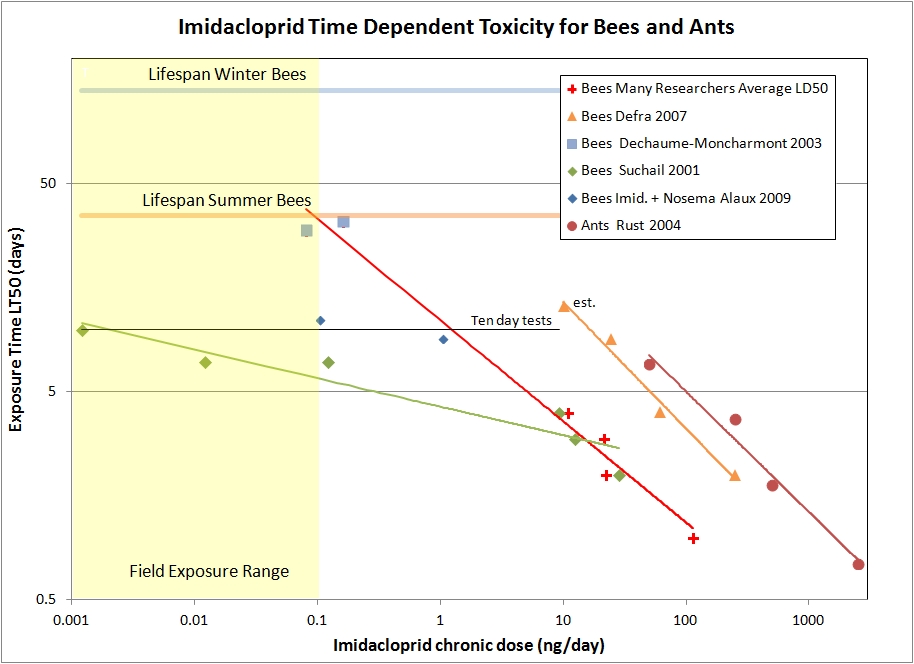
As it turns out, there is an interest in concocting ant baits that proffer sub-lethal doses of toxin to forager ants. A study done by Rust, et.al. 2004, has time-dependent toxicity measurements for imidacloprid on Argentine ants. For the honeybee data, we have the paper by Suchail et.al. 2001 that I discussed previously. However, there is general concern in the research community that there is something wrong with the Suchail results. Many other studies do not show such a high sensitivity to the toxin. So I looked for other experiments that also include time-to-effect measurements. There is a study by DEFRA (2007) that has time-to-effect figures, and also a compilation to many researchers’ LD50 numbers for 24, 48, 72, and 96 hr. periods (FERA 2013). To be able to plot both chronic and acute data on the same graph, I take the acute LD50 numbers and divide by the time interval for the measurement to obtain daily dose rates.Dechaume-Imidicloprid_chronic data At higher concentrations there is an anti-feedant effect that reduces the consumption rate, so I’ve plotted the reported consumption of toxin (ng/day) versus the time of exposure until half the bees have died (LT50). Many studies only follow the bees for 10 days or less. At lower concentrations, the LT50 time is never reached in the experiments. However, there is a paper by Dechaume-Moncharmont, et al. 2003, which contains a couple of data points with time-to-effect numbers for relatively low sub-lethal concentrations. The data show that 4-8 ppb samples eventually kills bees in about 30 days. I had to estimate the consumption rate for the ants in order to plot it with the other data, but an incorrect estimate would shift the curve left or right, but not change its slope. I show the power law best-fit line for each data set, where the Dechaume-Moncharmont points (blue squares) are included with LD50 averages from the FERA 2013 paper.First notice that the LT50 times for the Argentine ants do a remarkably good job of following a simple power law with roughly t1.7 dependence. This adds confidence to the utility of the empirical power law model for imidacloprid. Recall that simple accumulation to a toxic threshold would appear as directly proportional to time ( t1.0 ). An exponent larger than one can be interpreted as coming from damaging secondary physiological effects that take time to develop.
The DEFRA data stands out as not falling with the averages of other researchers. In general, there appears to be a wide variation between experiments, and hence individual colonies or strains of bees, to the sensitivity of this insecticide. The DEFRA study has time-to-effect numbers and consumption data, so it provides a good data set for looking at time scaling, even if the DEFRA bees are not particularly representative of most other bees tested. Again we see the data taken can be very well explained by the power law formulation, this time with about t1.6 dependence. We might expect that healthy individuals of similar species would exhibit similar temporal effects to the same toxin, and this seems to be the case. Finally, the average LD50 numbers from many researchers also fits the power law model. I also included the Dechaume-Moncharmont data in the power law fit, here about t2 . The Dechaume-Moncharmont data extends the model into the high field-realistic exposure range when approaching the lifespan of summer bees. If we extrapolate the curve to the lifespan of winter bees, we are well into the range of field-realistic exposure (0.01 ng/day). Hence, even with healthy bees, exposure to modest field-realistic levels of imidacloprid will compromise the longevity of winter bees, and could easily cause problems getting the bees through the winter.
It is known that imidacloprid is relatively quickly metabolized in the honeybee. The metabolic half-life is about 5 hours (Suchail 2004). Yet the effects of the poison are cumulative and long-lasting. This seeming paradox is explained by the fact that when the imidacloprid molecule binds to the nAChR receptor sites in the nervous system of the insect, it binds strongly and essentially irreversibly. So while free circulating imidacloprid may decay away, the damaging bound molecules remain, continuously compromising the nervous system.
The imidacloprid toxicity graph tells us that we need to be careful not to expose bees to more than a very few parts per billion (ppb) of toxin if we wish there to be no effect over the lifespan of the bees. Reports of levels of neonicotinoids from treated agricultural crops are frequently in the 1 to 5 ppb range. Typical honeybee consumption is about 20 µl/d, so at 5 ppb, the ingested toxin would be 0.1 ng/day which is the upper end of the yellow zone in the figure.
The Suchail (2001) results show a much higher sensitivity to imidacloprid than would fit the trends we see with the other data sets. Rather than the t2 dependence, lethal effect seems to scale as toxic concentration times t5. It is tempting to disregard the Suchail results, however one test site in trials by Shmuck (2004) also showed very high sensitivity to imidacloprid as well. Hence it is worth considering a secondary stressors that could result in a higher sensitivity to the toxin. The logical culprits would be pathogens, bacterial, viral or the microsporidian nosema.
Pathogen interactions with a host could lead to several time-dependent processes. First, damage to the host immune system has to occur for a pathogen to get a foothold. Then, before the host succumbs to the pathogen, the infectious organism must grow and multiply to lethal levels. Damage from the pathogen itself may take time to manifest in the host organism. Several of these time-dependent processes happening simultaneously would lead to a higher order time dependence.
The interaction between nosema and imidacloprid was studied by Alaux, et. al. (2010). The study fed bees 200,000 nosema spores to initiate infection and subject the bees to various doses of imidacloprid. There was some interaction between the pesticide and the pathogen, but the study only followed the bees for ten days so it is hard to draw conclusions at field-realistic doses, and the nosema infection dominated the experiment. Two data points from the study are plotted on our graph (blue diamonds).
A very good study, Aufauvre (2012), looks at the interaction of the systemic insecticide fipronil and nosema infection, and finds a strong synergy between the pesticide and the pathogen. The figure from that paper, below, shows what happens when sub lethal infection levels are combined with sub lethal insecticide exposure.
The curves (purple) show what happens with both the pathogen and the toxin combined. Neither nosema alone (red) nor fipronil alone (green) are very different from the control (blue), since low doses were used. However, the combination, given enough time, is especially lethal. The study examines the effects of the relative timing of the exposure and infection, but finds synergistic interaction between the pathogen and the toxin in all cases. The study followed the bees for twenty-two days, significantly longer than the typical ten-day chronic studies. The added time is crucial for the delayed toxic and synergistic effects to show up. The same is true with the Dechaume-Moncharmont experiment, where there were no deaths in either the control or exposed bees at the ten-day point, yet the toxic effect was clearly evident by day 30.
The choice of nosema as the pathogen for this study is convenient because the infection is easily accomplished with a spore solution, and the progress of the infection can be followed with microscopic examination of the bees. Curiously, the level of the nosema infection as measured by spore counts, was not much different with or without the pesticide exposure. Viruses are much more difficult to use as the infectious agent because of the difficulty of diagnosing their presence and quantifying the infectious dose and infection progress. However, viruses are more ubiquitous in honeybee colonies than nosema, and could easily have a similar synergistic interaction with pesticides on the bee’s health.
Cornman et al. (2012) found that CCD colonies were more likely to have higher levels of a wide variety of pathogens than weak, but non-CCD, colonies. Not only were the levels of pathogens higher, but multiple agents were frequently found in combinations not typical of non-CCD colonies. The figure below from that paper does a great job of graphically illustrating the situation
It looks like the immune system has gone awry. Could it be a few parts per billion of insecticide that makes the difference? More research is still needed here, perhaps looking at pesticide interaction with KBV or AMPV virus, since these viruses show up in CCD colonies.
Extrapolating LD50 numbers or 10-day chronic LC50 values to the lifetime of bees wintering in the honeybee colony requires some understanding of the time-dependent nature of the toxin. We have shown that the published LD50 and LC50 data can be empirically modeled using a simple power law. For imidacloprid with healthy honeybees, the time dependence is approximately t2 , indicating that not only is the exposure cumulative, but also that there are delayed toxic effects.
Queen bees can live for several years. Queen bees also need to consume large amounts of food in order to churn out the thousands of eggs they lay every day. This make queen bees especially susceptible to such a toxin. Queen failure was one of the precursors to colony mortality found by vanEngelsdorp et al. (2013). Queen failure, even if the bees succeed in raising a new one, will leave the colony without a fresh supply of young bees. A colony with pesticide stress may be relying on young bees to make up for those that disappear before their time.
I only looked at studies that addressed bee mortality. Bees affected by pesticide may not immediately die, but they may be practically useless to the colony, or may be unable to forage or navigate, and hence become lost and perish outside the hive. Quantifying behavioral effects is more difficult than counting dead bees, but one might expect that the time-to-effect scaling would be similar to the mortality data.
Bibliography
Alaux, C., Brunet, J.-L., Dussaubat, C., Mondet, F., Tchamitchan, S., Cousin, M., Brillard, J., Baldy, A., Belzunces, L. P. and Le Conte, Y. (2010), Interactions between Nosema microspores and a neonicotinoid weaken honeybees (Apis mellifera). Environmental Microbiology, 12: 774–782. doi: 10.1111/j.1462-2920.2009.02123.x
Aufauvre, J., D.G. Biron, et al. (2012). Parasite-insecticide interactions: a case study of Nosema ceranae and fipronil synergy on honeybee. Scientific Reports 2: 326. doi:10.1038/srep00326
Cornman RS, Tarpy DR, Chen Y, Jeffreys L, Lopez D, et al. (2012) Pathogen Webs in Collapsing Honey Bee Colonies. PLoS ONE 7(8): e43562. doi:10.1371/journal.pone.0043562
Cresswell, J.E. (2011). A meta-analysis of experiments testing the effects of a neonicotinoid insecticide (imidacloprid) on honey bees. Ecotoxicology,20(1), 149-157.
DEFRA – Department for Environment, Food and Rural Affairs (20o7): Assessment of the risk posed to honeybees by systemic pesticides. March 2007.
vanEngelsdorp D, Tarpy DR, Lengerich EJ, Pettis JS, Idiopathic brood disease syndrome and queen events as precursors of colony mortality in migratory beekeeping operations in the eastern United States. Preventive Veterinary Medicine, 108, 2–3, February 2013, Pages 225–233.
FERA – Food and Environment Research Agency, Neonicotinoid Pesticides and Bees,Report to Syngenta Ltd.
January 2013.
New York Times, March 29, 2013. Mystery Malady Kills More Bees, Heightening Worry on Farms
Sánchez-Bayo, F.,2009. From simple toxicological models to prediction of toxic
effects in time. Ecotoxicology 18,343–354.
Suchail, S.,Guez,D.,Belzunces, (2001), Discrepancy between acute and chronic toxicity induced by imidacloprid and its metabolites in Apis mellifera. Environ.Toxicol.Chem. 20,2482–2486.
Suchail, S., Debrauwer, L. and Belzunces, L. P. (2004), Metabolism of imidacloprid in Apis mellifera. Pest. Manag. Sci., 60: 291–296. doi: 10.1002/ps.772
Tennekes HA, Sánchez-Bayo F (2011) Time-Dependent Toxicity of Neonicotinoids and Other Toxicants: Implications for a New Approach to Risk Assessment. J Environment Analytic Toxicol S4:001. doi:10.4172/2161-0525.S4-001
Source (please consult for additional graphs described in the text): Gary Rondeau, 7 May 2013
http://squashpractice.wordpress.com/2013/05/07/time-dependent-toxicity-…
- Log in to post comments